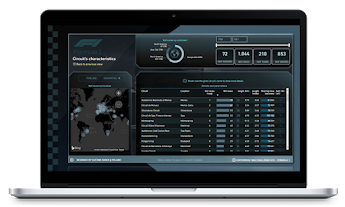
Formula 1 In-Depth Insights
Super dynamic report loaded with cohesively designed visuals using bookmarks, tooltips, object groupings and backgrounds, creating a superb navigation experience
AMS ·

Articles, case studies, and updates from AMSOL.
Super dynamic report loaded with cohesively designed visuals using bookmarks, tooltips, object groupings and backgrounds, creating a superb navigation experience
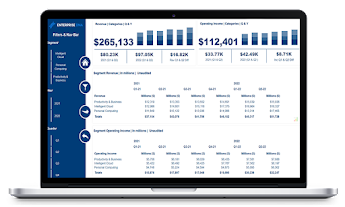
A detailed report with key financial metrics, such as revenue, profit,and net income, displayed in easy-to-read charts and tables

Comprehensive financial reporting application. Includes P&L, Balance Sheet, Cash Flow reports. Dynamic visualizations around key financial metrics

Dive into dynamic stock market data, reviewing key pricing and tradinginformation

A well-organized dashboard that uses easy navigation features, landing pages and side icons to show the effects of environmental issues to human health in the past 16 years …

An intuitive report designed with a very user-friendly dashboard that allows visualization of all indicators using filters

A user-friendly showcase with a clean design using filter options, illustrating data in summary statistics

A comprehensive illustration of a health problem caused by environmental factors, delivered in a well-designed data story using the Icon Map and Mapbox custom visuals, innovative navigational elements

A report with great visuals, filter options and features a variety of graphs for analysis

A striking report design, built with an intuitive navigation experience and a range of creative visuals to facilitate interactive data exploration.
New here? Already a member?