
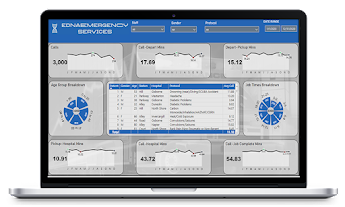
Emergency Response Analytics
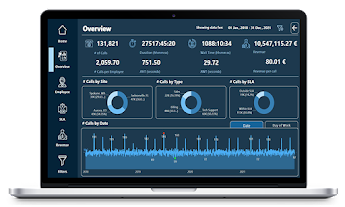
A well-thought report that features the main KPIs and specific data for each protocol of the Emergency Response Service, utilizing selected interactions, minimal visual elements and visible page …
AMS ·

Articles, case studies, and updates from AMSOL.
A well-thought report that features the main KPIs and specific data for each protocol of the Emergency Response Service, utilizing selected interactions, minimal visual elements and visible page …
A uniquely designed dashboard showcasing key insights using Charticulator and dynamic Heat Map for visuals
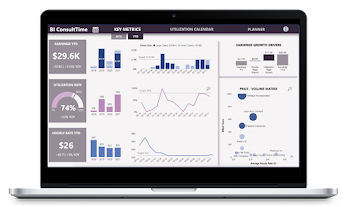
A compelling dashboard illustratingearning drivers for strategic planning, employing an innovative calendar display with conditional formatting and dynamic scenario analyses

Innovative and visually striking report, the centerpiece of which is an exceptionally detailed “what-if” analysis that examines yearly earnings across a variety of dimensions.
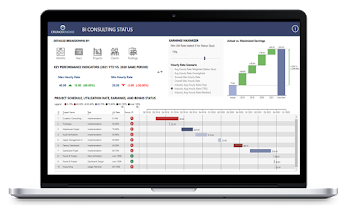
A compact one-page report thatleverages custom visuals, recently added UI features, and highly-detailed tooltips to provide extensive analysis of earnings and utilization
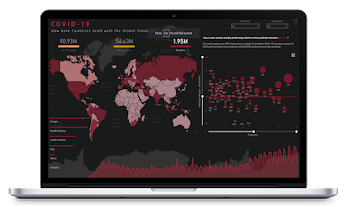
Analyze how countries dealt with COVID-19 through visuals, narratives, regression models, dynamic report level tool-tips, navigations, and maps
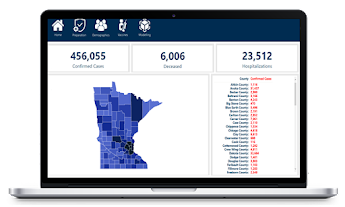
Explore COVID 19’s impact by demographics with a special focus on its effects by race/ethnicity in different facets of life, using advanced machine learning techniques.
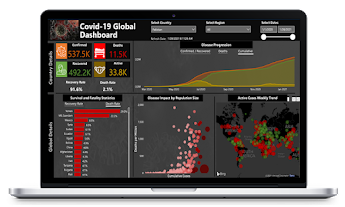
Analyze the COVID 19 global report that compares key metrics between regional and global levels
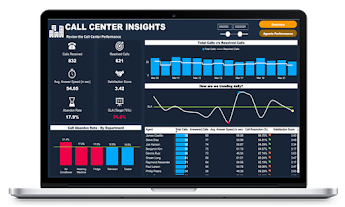
Review call center performance by analysing key metrics such as abandon rate, satisfaction score, SLA, and average answer speed.
A well-designed report using Flaticon iconography for UI design and various custom visualization techniques like popout report filter panel, PureViz animation and linking bookmark navigator to scatter chart.