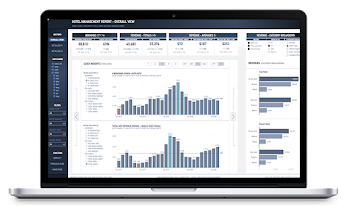
Hotel Management Report
A top-notch report design with easy navigation, using slicer selections for comparing different metrics and buttons to change views
AMS ·

Articles, case studies, and updates from AMSOL.
A top-notch report design with easy navigation, using slicer selections for comparing different metrics and buttons to change views
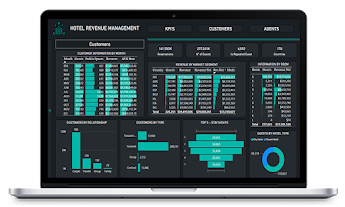
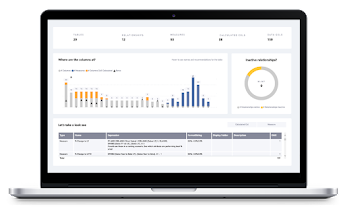
Nicely laid out report that uses tooltip; easy to navigate and has well-designed filter panel
Easy to navigate and nicely laid out report with simple and straightforward use of color, uses cross-filtering and variance of report matrix, also includes a notes page
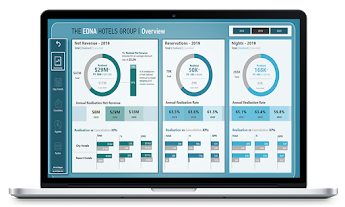
Simple yet seamless display of relevant data utilizing best practices in Power BI, formatted with JSON theme files
Minimalist design model documentation report that uses combo stacked chart and displays DAX expressions with description
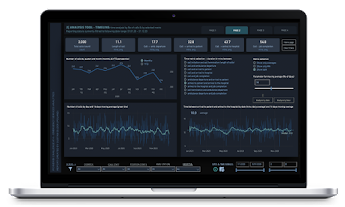
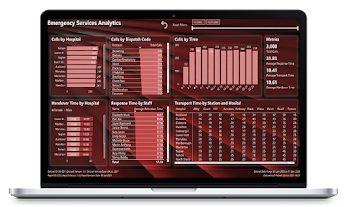
A well-designed health services analysis that effectively addresses the data from four different perspectives using timelines, drill-through and hovering techniques.
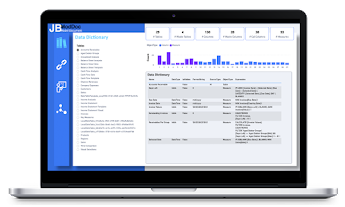
Dynamic visual overview of the data documentation collectedthrough advanced scripting.
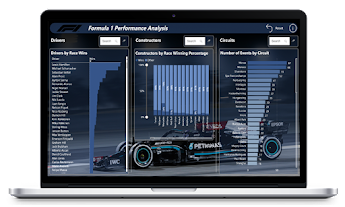
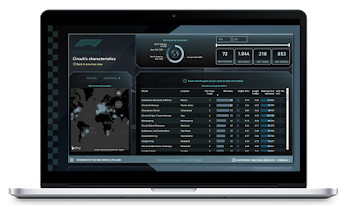
Meticulously designed and planned analysis of the performance of the Formula 1 drivers and constructors, built in a one-page report using tooltips and Text Filter visuals
Super dynamic report loaded with cohesively designed visuals using bookmarks, tooltips, object groupings and backgrounds, creating a superb navigation experience
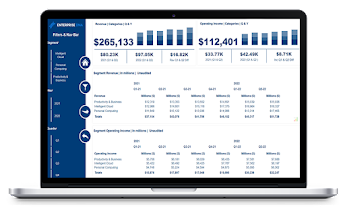
A detailed report with key financial metrics, such as revenue, profit,and net income, displayed in easy-to-read charts and tables