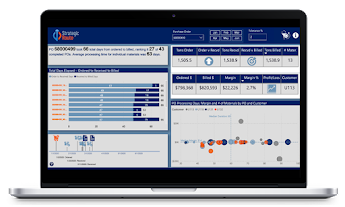
Sales Overview
Use four-quadrant scatter chart to provide enormous amount of information in a single chart.
AMS ·

Articles, case studies, and updates from AMSOL.
Use four-quadrant scatter chart to provide enormous amount of information in a single chart.
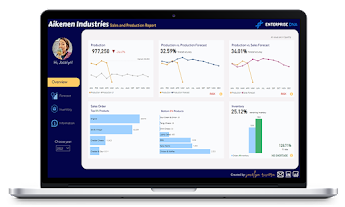
A concise, report with an excellent UX including outstanding use of color to convey key findings and an innovative information/help page
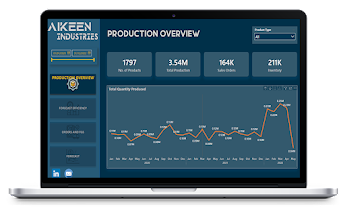
A well-designed report built on design best practices, leading to a smooth, intuitive user experience
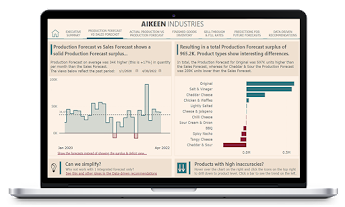
A unique report focused on actionable recommendations, that effectively uses extensive text and well-chosen visuals to address key analytical questions
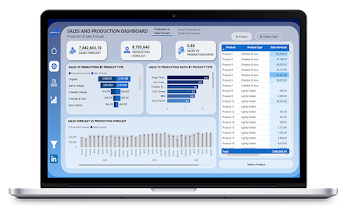
An easy to navigate report that makes good use of icons and native visuals
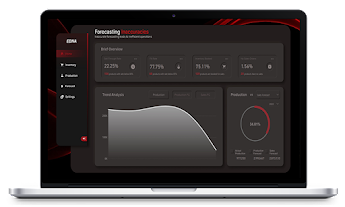
A polished report that highlights forecast inaccuracies using Deneb visuals, bookmarks and navigation, and R/Power BI integration
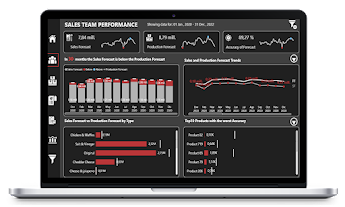
A well-executed report using an attractive dark-mode theme that makes excellent use of tooltips, dynamic text and a variety of visual types to address key questions
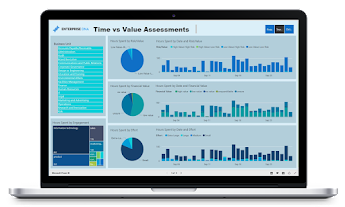
Review time spent on specific engagements and project with clients. Which business units are utilising services more than others. Evaluate professional service utilisation rates through time. Review return …
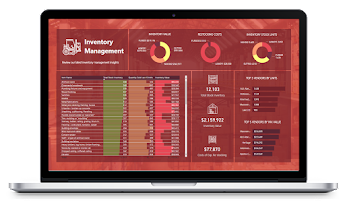
Deep dive into key performance metricsfor stock and inventory control. Manage stock levels within warehouse assets to current sales and future predicted sales
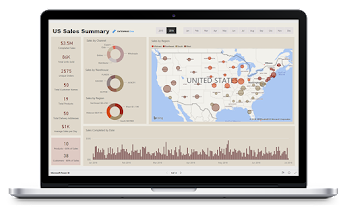
Sales analysis for FMCG business selling throughout the US. Drill into sales performance of each region or state. Watch key sales metrics as they happen and look for …
New here? Already a member?