
By Alaa Abdulhady, author of The Information Capital series
Healthcare runs on information. Many people who already understand patients, clinics and hospital workflows have exactly the context that data and AI teams need.
This article summarizes my talk for Well Employment in London, Ontario, on November 17, 2026. It offers a map, not a job guarantee or a shortcut. The message is simple: you do not have to start over. Your healthcare experience is the context; your job is to add data skills to it.
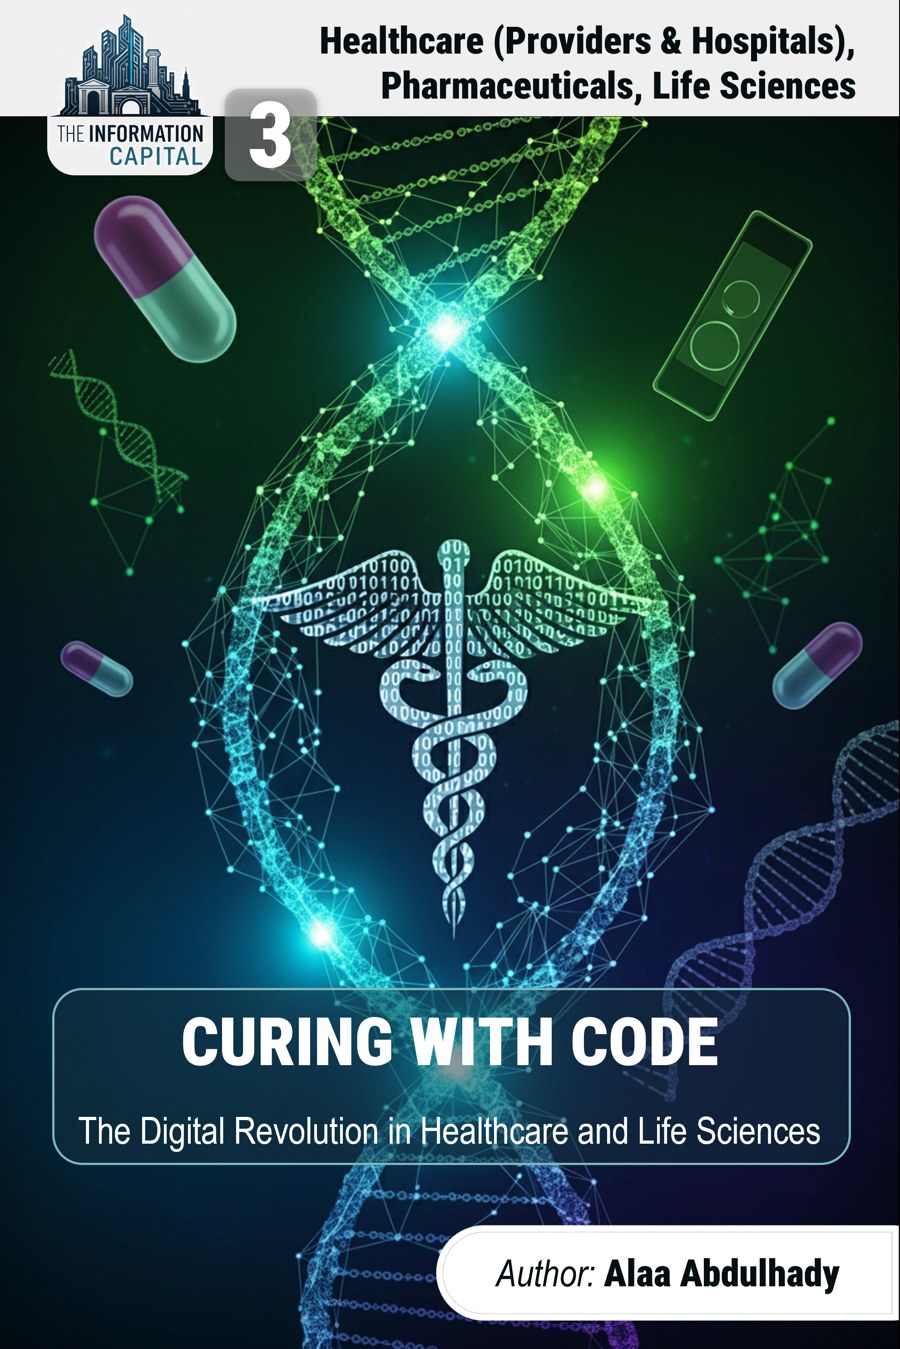
The talk draws on Curing with Code: The Digital Revolution in Healthcare and Life Sciences, Volume 3 of The Information Capital.
From an apple to an X-ray
How does a child learn that a round red object is an apple? Someone names it, and the child sees enough apples to notice the patterns. It is only an analogy, but it opens the door to how machine learning works:
- Data: photos of fruit, each one a recorded observation.
- Features: measurable properties such as colour, shape and size.
- Labels: the known answer, supplied by a person.
- Training: the algorithm adjusts until its guesses match the labels.
- Inference: it predicts a label for a photo it has never seen.
The same five steps apply to a chest X-ray, and that is where the limits start to matter. A study in Nature Machine Intelligence found that COVID-19 X-ray models could learn shortcuts, such as differences between scanners and hospitals, instead of the disease. They looked accurate, then failed elsewhere. So if a model scores 95% at one hospital, the first question is how it performs at yours.
Three terms often get mixed up:
- Clustering finds natural groups in unlabelled data.
- Supervised classification learns from labelled examples and predicts a label for new items.
- Retrieval-augmented generation (RAG) looks up documents first, then writes an answer from them. Answers can be more current and traceable, but they are not guaranteed to be correct.
What healthcare data is, and why it matters
Healthcare data comes from health records, laboratories, imaging, pharmacy, admission and discharge systems, home-monitoring devices, patient surveys, and the finance, workforce and supply systems that keep a hospital running.
A record on its own is just a fact. It becomes useful as it moves along a chain: data, information, insight, decision, outcome. Four cautions apply at every step: privacy, data quality, interoperability and context.
Canada is investing here. In June 2026, the federal government announced $100 million for the VITAL health data platform to connect de-identified hospital data for research.
AI tools: precise words matter
The tool you are most likely to meet first is the AI scribe, which drafts a clinical note from a consented conversation for the clinician to review and approve. Supply Ontario has an AI scribe Vendor of Record arrangement with 28 pre-qualified vendors. Pre-qualification is a procurement step, not an endorsement of clinical accuracy.
That distinction runs through the whole field. "Available", "marketed", "integrated" and "deployed" mean different things, and a vendor's claim is not independent evidence. Risk also varies by type of tool:
| Type of tool | Examples | The key question |
|---|---|---|
| Clinical | Imaging support, deterioration alerts | Is it a regulated medical device, and was it validated for this population? |
| Administrative or operational | Capacity forecasting, dashboards | Does it affect staffing or patient flow, and who monitors that? |
| General-purpose | Assistants for learning and drafting | What is its stated use? These are not clinical decision systems. |
For software that qualifies as a medical device, Health Canada's pre-market guidance for machine learning-enabled devices sets expectations for manufacturers.
AI suggests, professionals decide
Curing with Code calls human in the loop the most critical framework for responsible AI in healthcare. Data goes in, AI makes a suggestion, a qualified professional reviews and decides, and the organization monitors the results. Watch for four failure modes: automation bias, hallucination, bias against under-represented populations, and no clear route for raising concerns.
CHARTwatch at St. Michael's Hospital in Toronto shows the better version: alerts paired with a clinical pathway and a monitoring team. Its evaluation found fewer unanticipated deaths. It was not a randomized trial, so it is promising rather than proven for every hospital.
Business Intelligence: where many careers start
Business Intelligence (BI) turns data into reports, dashboards and decisions. The chain runs from source systems through quality checks and a governed model to a dashboard, an action, and an evaluation of whether the action worked. The first and last steps are the ones most often skipped.
The book's Information Capital framework has three pillars that reinforce one another. Here they are applied to a fictional discharge delay on a medical ward:
| Pillar | What it means | Discharge-delay example |
|---|---|---|
| Data Capital | Quality and accessibility of the data | Discharge and housekeeping timestamps with agreed definitions |
| Analytical Horsepower | The capacity to extract insight | A dashboard of discharge-order-to-bed-ready time |
| Decision Velocity | How quickly insight becomes action | A unit huddle that reviews it each morning and acts |
Knowing what a discharge delay really means on a ward is a large part of that first pillar. That is where your experience comes in.
Explore the report
I built this Power BI report for a fictional network of Ontario hospitals. It has 20 pages, including the executive overview, patient flow, the emergency department, readmissions, population health, supply chain, patient experience, workforce and data quality. Use the arrows at the bottom to move between pages.
The hospitals and all figures in this report are synthetic demo data, not real Ontario hospital performance or patient data.
As you explore, read the headline KPIs first, then ask which chart explains them. A number alone never decides anything.
Learn a few KPIs well
For any KPI, write down the calculation, which direction is better, what could mislead you, and where the data comes from. Check local or official definitions, such as CIHI's, before using one in real work.
- Bed occupancy: higher is not simply better, because very high occupancy strains patient flow.
- Average length of stay: lower is not simply better if patients come back.
- 30-day readmission rate: a useful balancing measure. If beds turn over faster because patients leave too early, readmissions will show it.
Two habits protect you. A rate that moves is a question, not an answer, so ask what else changed. And when a measure becomes a target, it can stop being a good measure, which is why you pair targets with balancing measures.
People and ethics decide whether data gets used
The best dashboard is useless if nobody trusts it. The book's answer is the Three E's: educate with role-based training and a data dictionary, empower with self-service tools and data champions, and evangelize through leaders who use the data themselves.
Internationally trained professionals often arrive with these human skills. You know what a clinician needs at the point of care, you have worked across disciplines and often across languages, and having seen other health systems sharpens your sense of what a definition really means.
Trust is also the licence to operate. In Canada, useful reference points include Ontario's PHIPA, the Information and Privacy Commissioner of Ontario's guidance on AI scribes, and the Pan-Canadian AI for Health guiding principles. This is education, not legal advice; an employer's privacy officer is the person to ask.
Eight role types to explore
Job titles vary, so treat these as search ideas. Some roles may need Canadian credentials or privacy training, and none comes with a guarantee of employment.
| Role type | Experience you may bring | Portfolio artifact |
|---|---|---|
| Clinical data or reporting analyst | Charting, coding awareness | KPI sheet with definitions |
| Health informatics or EMR specialist | Using EMRs, training colleagues | Annotated workflow map |
| Quality improvement or patient safety analyst | Incident reviews, audits | Run chart with a balancing measure |
| BI or decision-support analyst | Knowing what decisions need | Clinic dashboard on synthetic data |
| AI-tool implementation or clinical documentation | Documentation, clinical review | Adoption checklist |
| Privacy and data governance coordinator | Confidentiality, consent practice | Data dictionary and privacy note |
| Research or health-data coordinator | Protocols, patient data handling | Cleaned public dataset with methods |
| Operations or patient-flow analyst | Bed management, scheduling | Patient-flow dashboard |
Read ten postings for each role you like and note the repeated requirements. That list is your learning plan.
A 90-day plan
| Period | What to do |
|---|---|
| Days 1–30: literacy | Learn basic data terms, work with Excel, practise spotting data-quality problems, learn a handful of KPIs, and read your province's privacy basics. |
| Days 31–60: tools | Learn Power BI basics and SQL fundamentals, how to choose the right chart, and how to tell a story with data. |
| Days 61–90: portfolio | Build a dashboard for a fictional clinic, with a one-page data dictionary, three KPIs with caveats, and a note on privacy and limitations. |
Use only synthetic or public data, and never real patient data, including anything you remember from past work. Along the way, hold two or three informational interviews and ask people how they got there.
Key takeaways
- Data becomes valuable only when it changes a decision.
- AI tools are assistants that need human review and a clear intended use.
- Learn a few KPIs well, with their definitions and caveats.
- In healthcare, ethics and privacy are the licence to operate.
- You do not have to start over. Add data skills to the experience you already have.
So here is the question to take with you: what healthcare problem would you like to solve with data?
About the author
Alaa Abdulhady has more than thirty years of experience in strategy management and business analytics across finance, military, oil and gas, human resources, government and engineering. Alaa is the founder of the Information Capital initiative and author of The Information Capital book series, and holds an MBA in Strategy Management from Maastricht School of Management. Alaa is not a clinician and brings the view from the data and strategy side.
To learn more, visit amsol.ca or alaahady.com.
This article is for education only. It is not medical, legal or career advice, and tool features and regulations change, so check current sources before relying on them.