

By Alaa Abdulhady, author of The Information Capital series
Most manufacturers already have Power BI. Far fewer have a business intelligence strategy that decides what it should be used for.
I presented this topic to the Egypt Fabric & Power BI User Group, and the message of the talk fits in one line: tools do not create value, decisions do. Microsoft Fabric is the engine; strategy decides where it drives. This article summarizes the session, and you can explore the working Power BI report from the case study below.
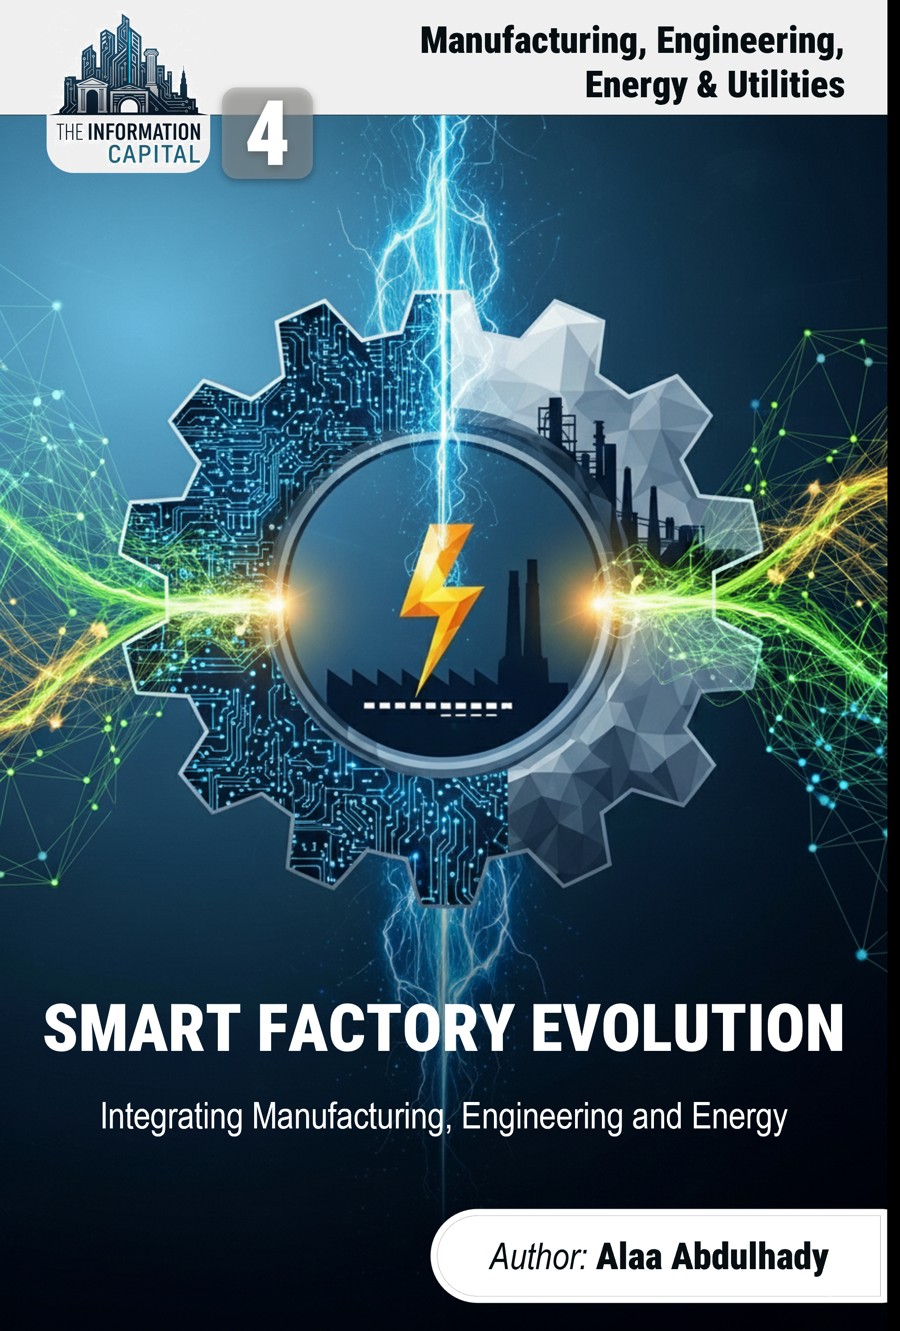
The session draws on Smart Factory Evolution: Integrating Manufacturing, Engineering and Energy, Volume 4 of The Information Capital.
The challenge is no longer generating data
Every modern plant produces a torrent of data: ERP logs orders, MES tracks work in progress, SCADA monitors processes and IoT sensors measure vibration and temperature. The hard part is turning that data into action. The Information Capital framework gives us three terms for it:
- Data Capital is the raw material.
- Analytical Horsepower is the engine that processes it, including the people with the skills to use it.
- Decision Velocity is the speed from insight to action.
Outcomes then feed back as new data, creating a reinforcing cycle.
Choosing a platform is a business decision
Choosing a BI platform is not an IT procurement exercise. The right platform is the one that strengthens all three pillars in your context. For organizations that have chosen Power BI, the strategic question is what sits underneath it.
Fabric brings data integration, engineering, warehousing, data science, real-time intelligence and Power BI onto one SaaS platform, with one lake (OneLake) and shared governance. That lets you map every workload to a pillar:
| Pillar | Microsoft Fabric components |
|---|---|
| Data Capital | OneLake, Lakehouse, Warehouse, Data Factory, mirroring, Purview governance |
| Analytical Horsepower | Notebooks and Spark, data science, semantic models, Copilot |
| Decision Velocity | Power BI reports and apps, Real-Time Intelligence, Activator, delivery in Teams |
My advice: decide on the problems first, then turn on only the Fabric experiences you need.
Start with one problem, and OEE is the natural capstone
The book sets out ten high-impact BI applications for manufacturing: OEE, predictive maintenance, supply chain and inventory, production planning, quality, demand and capacity, cost of production, workforce and safety, energy and sustainability, and supplier performance.
They reinforce one another. Predictive maintenance raises OEE availability, quality analytics raise the quality factor, and supplier performance protects the schedule. Even so, do not build all ten at once. Solve one critical problem, prove the return, and use that success to fund the next.
Overall Equipment Effectiveness (Availability × Performance × Quality) is often the best place to start, because it reflects the health of maintenance, quality and planning at the same time. It also exposes the hidden factory: capacity you already pay for but lose to stops, slow cycles and defects. Moving OEE from 65% to 75% means roughly 15% more sellable output from the same assets.
Northstar: a smart-factory case built end to end
To test these ideas, I built Northstar Climate Systems, a fictional commercial HVAC manufacturer with three product families, five production lines, 44 B2B customers and 22 suppliers, over 36 months. All of its data is synthetic, generated by a simulation so that orders, shipments, production, inventory and finance reconcile.
The data contains three stories a BI estate should detect and explain:
- Seasonality: rooftop orders peak in summer, and healthcare and data-center customers spend their budgets in Q4.
- Disruption: in 2024, heat-pump compressor lead times and prices spike. Stock cushions revenue for a while, then OTIF falls from about 95% to about 81%.
- Improvement: in 2025, a Lean and Kaizen programme on Line-103 cuts rework and lifts that line's OEE from the low 70s to the mid 80s.
Explore the report
The report has nine pages, covering the executive scorecard, finance, sales, production, supply chain, quality, people and sustainability, reliability and schedule, and cost and supplier KPIs. Use the arrows at the bottom to move between pages.
Northstar Climate Systems is a fictional company. The figures are synthetic demo data, not real performance.
What the build teaches
The case includes a 28-table workbook and a Power BI project with 229 measures, covering 39 of the 40 operational KPIs listed in the book. The one left out is predictive accuracy, because Northstar has no failure-prediction model to measure. Four lessons carry over to any manufacturer:
- Keep the star schema strict. Northstar's facts sit at their natural grain around shared dimensions, with 37 designed relationships, four of them inactive role-playing dates. Allow only one active path between any two tables, and do not mix Desktop's auto-detected relationships with designed ones.
- Write DAX that aggregates correctly. Calculate OEE as a ratio of sums so it holds at any level. Use
USERELATIONSHIPto measure OTIF by promised month, andTREATASto filter by order date without adding an ambiguous path. - Put thresholds in the model. Colour rules are DAX measures, so changing a threshold happens in one place and the rule can be reused across visuals.
- Earn trust before launch. The workbook runs 63 automated reconciliation checks, covering inventory roll-forward, sales against finance, production identities and key integrity. In Fabric, these become notebook or pipeline checks in the silver layer, published as a data-quality page.
How Northstar would run on Fabric
The demo itself was built with Excel and Power BI Desktop. The production path on Fabric looks like this:
- Ingest: Data Factory pipelines and Dataflows Gen2 bring ERP, MES, quality, maintenance, HR and energy data into the bronze layer of a lakehouse.
- Conform: notebooks or dataflows clean the data into silver Delta tables, with the reconciliation checks running here.
- Model: the gold layer holds the star schema, and a Direct Lake semantic model reads it from OneLake.
- Act: Power BI delivers role-based reports and apps, while Activator watches measures such as OTIF and raises alerts.
Technology does not decide whether BI gets used
The world's best dashboard is useless if no one trusts it. On the factory floor, resistance has familiar faces: the veteran operator who can hear when a machine will fail, the engineer juggling too many systems, the skeptic who finds one faulty reading to discredit everything, and the plant that guards its data.
- Culture: educate with role-based training and a metric dictionary, empower with self-service and data champions on each shift, and have leaders open every production meeting with the dashboard.
- ROI: set a baseline first, isolate the impact with a control line where you can, and tailor the story to the CFO, the plant manager and maintenance.
- The semantic layer: generative AI, hyper-automation and embedded analytics all depend on trusted business definitions. A well-governed semantic model is what makes Copilot answers reliable.
- Ethics: the sensor that improves safety can also monitor break times, and a model trained on new plants can under-serve older ones. Design for privacy, make recommendations explainable, and keep people accountable for decisions. In Fabric, row-level security, sensitivity labels and lineage support this work.
A 90-day plan
| Period | What to do |
|---|---|
| Days 1–30 | Pick one critical problem, usually OEE or OTIF. Write the metric dictionary and measure the baseline. |
| Days 31–60 | Land the sources in a lakehouse, build bronze, silver and gold layers, add reconciliation checks, and publish a Direct Lake semantic model. |
| Days 61–90 | Deliver the role-based report and app, name data champions per shift, add one Activator alert, and present the ROI story. Then move to the next application. |
Key takeaways
- Choose your platform by strategy, not by feature list.
- Fabric's value is removing the plumbing between Data Capital, Analytical Horsepower and Decision Velocity.
- Start with one smart-factory problem, and prove the return.
- The semantic model and data-quality checks are the strategy; the dashboards are the surface.
- Culture, ROI and ethics decide whether any of it gets used.
About the author
Alaa Abdulhady has more than thirty years of experience in strategy management and business analytics across finance, oil and gas, government, engineering and other sectors. Alaa is the founder of the Information Capital initiative and author of The Information Capital book series, and works with Advanced Management Solutions (AMS).
To discuss a BI strategy for your plant, visit amsol.ca. To learn more about the book series, visit alaahady.com.