Project KPIs are measurable indicators that help to track a project’s performance. To ensure that projects get completed on time, project managers need to monitor and understand their team’s work process and lead the project towards long-term goals. The quickest way to get a complete overview of your project performance is to use a
The quickest way to get a complete overview of your project performance is to use a project KPI dashboard.
In order to create a comprehensive and actionable project dashboard, you need to detect the right metrics and KPIs. Compiling a comprehensive list of actionable project KPIs is not a 1-hour task, it takes determination and persistence to frame KPIs that reflect on your project’s actual performance.
Here’s the golden rule of KPI dashboards: each and every project metric should be measurable, actionable and visually understandable.
To frame actionable project KPIs that help to improve your team’s performance, see the list of frequently used project KPIs and think how you could apply these metrics to track your own team’s performance.
First, we’re going to take a look at 3 primary project management metrics:
1. Planned Value (PV) project KPI
This metric is also referred to as Budgeted Cost of Work Scheduled (BCWS).
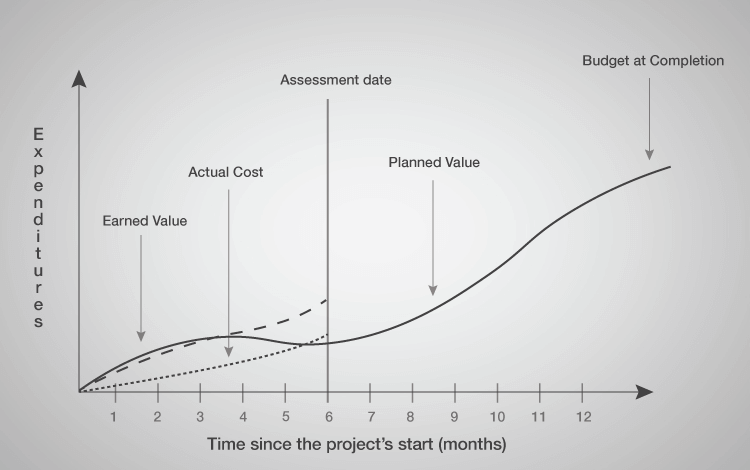
The planned value is the estimated cost for your project activities planned/scheduled as of reporting date.
Compare the Planned Value with the other project KPIs to see whether you’re running ahead of schedule or have already spent a bigger slice of your budget than scheduled to date.
PV can be calculated by these two formulas:
Planned value = (the hours left scheduled on the project) X (project worker’s hourly rate)
Planned Value = (Planned % of tasks left to complete) X (project budget)
For example, if you have a one-year project with a total planned budget of 10 000 USD, the Planned Value after 9 months (if you’re on schedule, you’ve completed 75% of the project activities and you’ve got 25% to go) is 25% of 10 000 USD which makes 2500 USD. Meaning that the project planned value at this point of the project is 2500 USD.
If you’ve actually spent more to date, it means that your Actual Cost has been higher than the Planned Value.
2. Actual Cost (AC) project KPI
The Actual Cost KPI is also referred to as the Actual Cost of Work Performed (ACWP).
It indicates how much money you have spent on a project as to date. There’s no formula for calculating the project’s actual cost, you just have to add up all the project-related expenses you’ve used to date.
A project budget is calculated considering all the hours planned for the project, so use the time spent on tasks to calculate the Actual Cost spent on salaries, resources etc.
3. Earned Value (EV) project KPI
This KPI is also referred to as >Budgeted Cost of Work Performed (BCWP).
This project KPI shows the approved budget for all the performed project activities by a specified date. It shows how much-planned work you have actually accomplished and what’s the budget for these accomplishments.
When managing multiple projects, it’s best to create multiple KPI dashboards. For example one for each extensive project, one that summarizes all projects’ performance and a team dashboard to keep everyone updated.

Now that we’re done with the basics, let’s move on to more complex project KPIs that give us a complete overview of the project and business performance and are a must-have on your project tracking dashboard.
If you’re still looking for a perfect tool for your project team, learn about the essential features of the best project management software.
4. Return on Investment (ROI)
Project’s ROI reflects on its profitability and shows whether the benefits of the project exceed its cost.
Not all projects are destined to have a positive ROI in the first place. Sometimes, the ROI should be considered long-term as some projects take more time to grow profits.
ROI metrics on the project KPI dashboard should be derived from measurable components like the project’s Actual Cost and Earned Value.
5. Cost Variance (CV) (Planned Budget vs Actual Budget)
Project’s cost variance reflects the project expenses.
It indicates whether the estimated cost of your project is below or above the planned baseline. To calculate the Cost Variance, compare the Planned Budget to Actual budget at a given time.
When measuring the Cost Variance, you can easily notice whether you’re beyond or above your approved budget.
6. Cost Performance Index (CPI)
This project KPI helps you approximate how much time you’re behind or ahead of the approved project schedule. CPI is the ratio of the planned budget to what you’ve actually spent to accomplish these tasks.
As The Cost Performance Index suggests the relative value of work done, it can be seen as the indicator of the project’s cost efficiency.
Want to create your own KPIs? See the complete guide to creating a KPI report.
7. Cost of managing processes
Add this metric to your project dashboard to get an overview of the time and resources spent on supervising and managing the project.
If the cost of managing processes seems too high, it might indicate that your project manager’s doing an inefficient job.
On the other hand, if the management costs are too low, it means that your teamwork may be poorly organised. It’s normal for the team to spend time on project meetings, making sure that everyone’s on the same page.
You can ease the project manager’s workload by using automated invoicing and time billing software, saving hours every week.
8. Planned hours of work vs actual situation
Overseeing this project metric indicates how many working hours were planned for the project processes compared to the actual time spent. You can apply this metric to different time periods and compare multiple project phases. If the actual amount of hours spent highly exceeds the scheduled time, it’s time to re-estimate the time scheduled for the project.
To organize your projects and finish everything on time, consider using work scheduling and project planning software.
9. Overdue project tasks / crossed deadlines
Add this metric to your project tracking dashboard to get an overview of how many project activities are overdue. This KPI is a calculated percentage of projects with crossed deadlines compared to all the completed project activities.
If you have a high percentage of overdue tasks, it’s time to think through the project schedule and bring in some new contributors.
10. Schedule Variance (SV)
Schedule Variance shows how much ahead or behind of planned budget (and scheduled work), your project is running.
It can be calculated by subtracting the project’s Planned Value of its Earned Value.
In other words, you take the time and budget that you initially planned to spend up to date and subtract it from the actual budget spent to date. If the sum is negative, it means that you have managed to achieve more than planned and have a bigger budget left to spend on remaining tasks.
11. Schedule performance index (SPI)
This project management KPI will tell you whether you’re ahead or behind the planned project schedule.
It’s similar to many previous KPIs, except that the value of this metric is always close to number one.
To calculate the Schedule Performance Index, divide the project’s Earned Value (EV) with the Planned Value (PV). If this metric is less than one, it indicates that the project is potentially behind schedule. If the SPI is greater than one, it indicates that the project is running ahead of schedule.
Schedule Performance Index = (Earned Value) / (Planned Value)
12. Missed milestones
Similar to the number of missed deadlines, this KPI is widely used in project dashboards. It indicates whether you’ve overestimated your capacities and are running behind schedule or you’re doing just fine, never missing a milestone.
It’s okay to miss a couple of milestones during a long-term project process, but if it’s becoming a rule instead of the exception, it may be a sign that you need to review the whole project process.
13. Percentage of tasks completed
To get a really quick overview of your project’s performance, create a KPI indicating the percentage of completed tasks.
Enter the planned time for each project activity so that the KPI won’t reflect the number of various-size tasks but the time spent. You’ll get more accurate reporting and understand what phase your project actually stands.
14. Resource utilization
While the majority of previously listed project management KPIs indicate how your project currently performs, resource utilisation enables a quick glance at your team’s work.
Resource utilisation measures how the time of team members is used while working on the project.
It implies how much time are people working on billable activities compared to the time spent on non-billable tasks.
This metric is specifically important when working with multiple customers, for example, various agencies need to watch this KPI. You’ll notice how many hours are spent on meetings and scheduling instead of actually working on the billable project activities.
15. Percentage of projects completed on time
If you’re frequently handling multiple projects, this KPI is a must-have on your project management dashboard.
This project KPI indicates the number of projects completed on time compared to crossed deadlines.
If you’re not able to keep this percentage over 80%, it might be time to hire some new team members or accept fewer projects from customers.
16. Percentage of cancelled projects
Similarly to the previous project performance indicator, it’s widely used by agencies that frequently take up new projects. But the number of cancelled projects also reflects on a company’s capability to plan ahead. Foreseeing whether a project is going to be profitable and the team sufficiently qualified to achieve all the project goals.
Perceive the percentage of cancelled projects as a reflection on the sustainability of your business decisions.
Trying to take on fewer projects that are doomed to fail or simply cancelled because they’re not imperative to your company’s goals.
Want more? Learn about measuring your sales performance by viewing the list of 16 sales metrics that are frequently used on executive dashboards.
If you’re into marketing, don’t miss out on a helpful guide for tracking and improving over 30 relevant marketing KPIs or the guide to understanding popular financial KPIs.
Remember: an extensive project dashboard gives a complete overview of the project and team performance. Depending on your goals, add to your KPI tracking dashboard accurate metrics that help you make informed decisions and to keep your hand on the pulse of every project process. Monitor KPIs that are actionable and measurable to get the highest benefit.
By: Karola Karlson


