KPI Basics:
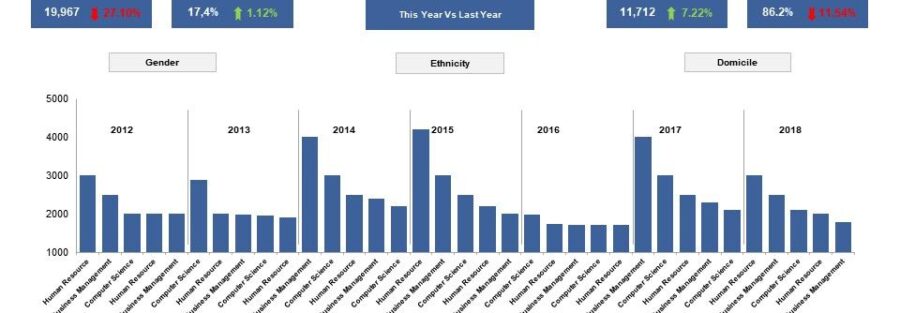
A “KPI” is a Key Performance Indicator, or in other words something that we can track or measure. An example of a KPI in higher education is Student-to-Faculty Ratio. This is a number, that varies from year to year, that represents the number of faculty that work at the University compared to the number of students enrolled at the University. Many say that this key ratio represents the quality of teaching in a University. The idea is that students are better off if there are more faculty members working there. Students will get more attention, there will be more choices in terms of classes, and there will be more opportunities for collaboration or advising with faculty. Most, if not all, universities track this ratio, and therefore it also provides an easy method to compare universities to each other. This type of KPI can be easily measured and tracked with data that the university already tracks within their administrative systems. Some KPI’s can be tracked with external data, such as surveys. In the US, we have the National Survey for Student Engagement, nsse.iub.edu, where this central organization distributes surveys to students, collects the information, and then provides assessments and feedback to the university. KPI’s can be used to determine changes within the university or to compare with a group of peer universities.
Who uses KPI’s?
I have seen KPI’s used in varying degrees by different universities. Of course, most universities are required to track some KPI’s for external compliance purposes as well as internal management. KPI tracking is often a part of a Performance Management initiative, where the university wants to standardize on a broad set of metrics across all areas of the organization. In other words, they want to go from sporadic pockets of KPI tracking (perhaps in spreadsheets/offline systems), to formally establishing KPI’s, setting targets for each KPI, and benchmarking against peers – across all colleges/departments and using data directly based on administrative system sources. Sometimes, the “drive to measurement” starts with a new Provost or President, who has effectively used KPI’s before.
Any discussion of KPI’s should be tempered with some reality. KPI’s cannot possibly encapsulate every different angle that is important to each constituent of a university. Even if we equip a car with the latest gadgetry and on-board computers, we will still need a driver to decide where we are going and to get us there safely. KPI’s and performance management systems can be effective tools, but they still require the right people to translate the results into the right course of actions.
KPI Examples in Higher Education:
Here is a pretty good list of KPI’s that I have gathered from speaking and meeting with various universities. Hopefully this will be useful for you, and I welcome your thoughts about KPI’s in Higher Education.
I have structured the KPI’s so they fall under a perspective and then an objective.
Academic Perspective
| Student Success: Recruit, retain, graduate the best students | Student Recruitment Metrics: |
| Freshman Inquiries | |
| Freshman Conversion | |
| Freshman Applications | |
| Freshman Selectivity | |
| Freshman Accepted | |
| Freshman Yield | |
| Freshman Enrolled | |
| SAT/ACT Score Quality | |
| Top 10% Rank in Class | |
| Discount Rate | |
| % of Financial Need Met | |
| Graduation Metrics: | |
| Degrees Conferred | |
| % of Students Gaining Employment within x months | |
| Retention Metrics: | |
| 4-Year Graduation Rate | |
| 5-Year Graduation Rate | |
| 6-Year Graduation Rate | |
| 1-year Retention Rate | |
| Graduate Student Metrics: | |
| # of Research Assistants | |
| GRE Quantitative Score |
| Provide Quality Academic Programs and Support Services | % of Course Sections with an enrollment of 20 or less |
| % of Course Sections with an enrollment of 50 or more | |
| Passing Rate for National Licenses or Exams (e.g. Nursing, Pharmacy, Law, etc) | |
| Academic Support Spending per Student Headcount | |
| Instructional Spending per Student Headcount | |
| Student Participation in Study Abroad |
| Attract and retain outstanding faculty/staff | Faculty-to-Student Ratio |
| Average Faculty Salary and Benefits | |
| Employee Satisfaction | |
| Faculty Tenure Rate | |
| Number of Endowed chairs and professorships | |
| Staff Turnover Rate | |
| Staff participation in central HR training |
Financial Perspective
| Optimize Expenditures | Administration Spending per Student |
| Departments exceeding budget | |
| Number of Financial Shadow Systems | |
| Complete all capital projects on-time |
| Advancement and Endowment | Average Alumni Giving Rate |
| % of Campaign Goal Pledged | |
| % of Campaign Goal Collected | |
| Endowment per Student Headcount |
| Remain Compliant | A-21 Audit Findings |
| Cost of compliance as % of budget | |
| Laboratory Safety Violations | |
| OFAC Compliance Violations | |
| Time to close fiscal year (in weeks) | |
| Violations of OSHA, HFPA, BOCA, NRC, and FDA |
Research Perspective
| Increase Funded Research | Contracts and Grants Funding Awarded |
| NIH Grants Funding Awarded | |
| Number of Patents Issued | |
| Proposal Success Rate |
| Provide Adequate Research Facilities | New Lab space available for research |
| Laboratory Safety Violations | |
| Sq Ft of Incubator Space |
| Increase Faculty Scholarly Activities | Members of National Academies |
| Number of publications or performances in national outlets | |
| # of Tenured Faculty |
Campus and Community Perspective
| Improve Campus Life | # of Public Safety Officers |
| Campus Wireless Network Coverage | |
| NSSE Supportive Campus Environment | |
| Number of Students graduating late due to course availability | |
| Community Perception Survey Score |
| Support Integrity and Service to Community | Funding for Public Services Initiatives |
| Student Awareness of Code of Ethics |
| Support superior athletics | Graduation Rate for Freshman Student athletes |
| Placement in Directors Cup | |
| Student Participation Rate in Intramural Athletics or Sports Clubs | |
| Reduce CO2 Emissions to Target |
| Promote and Enhance Sustainability | % of Space LEED Certified |
| % Spend with “Sustainable” Vendors |
By: Craig Kennedy


